10
Mar 2026
How Pension Funds and Sovereign Wealth Capital Are Transforming African Real Estate: The Institutionalization Wave (2025-2030)
By Sir Felix Modebe B.Sc., M.Sc., MBA, FRICS, CCIM, KSJI
Visionary Founder-Leader | N3 CAPITAL AFRICA
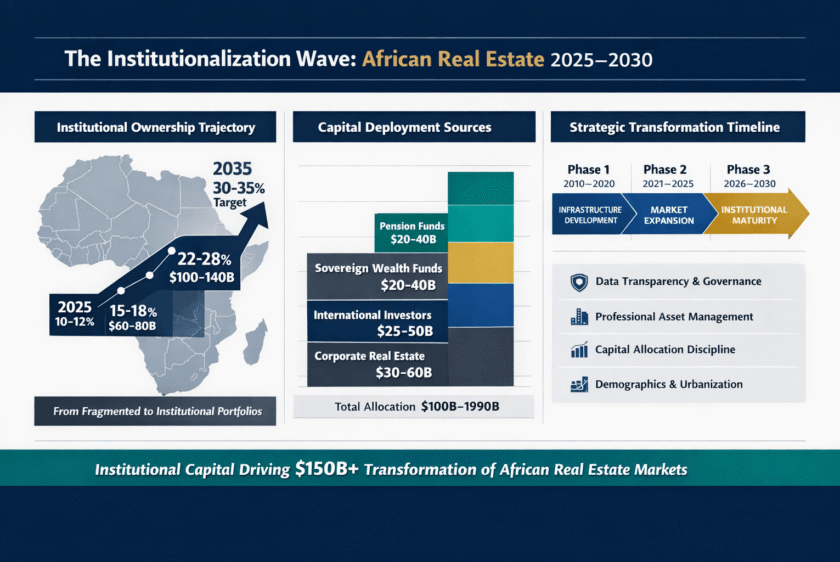
African real estate undergoes fundamental transformation as institutional capital—pension funds and sovereign wealth vehicles—shifts markets from fragmented ownership toward institutional-grade CRE portfolios. Institutional ownership expands from 8-12% (2025, $35-45B deployed) to projected 22-28% (2030, $100-140B) as demographics, infrastructure gaps, governance reforms, and ESG compliance converge with $150+ billion institutional capital seeking African real estate exposure.
The Institutionalization Wave: What It Means
Definition: Transformation from individual/family ownership (historically 60-70% of African CRE) toward sophisticated institutional portfolios managed by professional asset managers employing systematic underwriting, transparent reporting, standardized documentation, and fiduciary governance.
Global Precedents: US (1960s-1980s), Europe (1980s-2000s), Asia-Pacific (1990s-2010s), Emerging Markets (2000s-2020s)—all experienced 15-25 year transitions from fragmented ownership to institutional portfolios reaching 25-35% of commercial real estate.
African Timeline: Phase 1 (2010-2020) infrastructure establishment, Phase 2 (2021-2025) market development, Phase 3 (2026-2035) maturity achievement with institutional ownership reaching 25-30%.
Key Transformation Drivers
Data Transparency & Governance: Transaction databases publishing pricing/cap rates/lease terms, professional appraisals by international firms (CBRE, Knight Frank, JLL), electronic land registries, beneficial ownership disclosure, independent boards with fiduciary standards, stakeholder protections.
Professional Asset Management: 3-5 year strategic planning, proactive maintenance, systematic leasing, performance monitoring—replacing reactive owner-management with institutional sophistication generating 15-25% return improvements.
Capital Allocation Discipline: Minimum transaction sizes ($10-50M+), institutional-quality tenants, growth market positioning, clear exit strategies, geographic/sector diversification, risk-return optimization, 12-18% gross IRR targets.
Demographics & Urbanization: 500 million additional urban residents by 2050 requiring 2.5 billion sqm commercial infrastructure—sustained demand growth impossible in developed markets.
Infrastructure Deficits: $30-40B annual shortfall creating persistent supply-demand imbalances—modern logistics (20M sqm deficit), Grade A office (5-7M sqm shortage), healthcare ($80B requirement), data centers ($15B need).
Macro Stability: Democratic transitions (peaceful elections, coalition governments), policy predictability (multi-year plans, investor protections), governance reforms (anti-corruption, judicial independence), inflation control (15-30% toward 5-10% targets), fiscal discipline (IMF programs, subsidy reforms).
Pension Entry Strategies
PropTech Investment ($500-800M annually): Digital marketplaces reducing transaction costs, cloud-based property management automating operations, blockchain-enabled fractional ownership democratizing access, AI-powered valuation tools providing real-time pricing.
Real Estate Operating Companies ($200-400M annually): Student housing serving expanding enrollment (15-20% growth), co-living/co-working targeting millennials and startups, logistics platforms for e-commerce, scalable affordable housing models. Target returns: 25-35% gross IRR through revenue growth, operational efficiency, eventual IPO or strategic sale.
Sovereign Wealth Fund Positioning
Domestic Mandates:
- Nigerian NSIA: $3-5B deployment (logistics, healthcare, affordable housing)
- Botswana PULA: $1-2B regional diversification (office, retail, logistics)
- South African GEPF: $4-6B infrastructure (logistics, renewable energy, telecom, healthcare)
- Ghanaian SWF: $500M-1B oil-sector infrastructure, telecommunications, agribusiness
International Allocation:
- Middle Eastern funds (UAE, Saudi, Qatar): $5-8B seeking yield enhancement (10-15% vs. 4-6% developed)
- Asian sovereign wealth (Singapore GIC, Malaysia Khazanah): $3-5B targeting institutional-quality assets in established markets
Combined Deployment: $20-40B (2024-2027) creating significant market transformation.
Corporate SLB & BTS Acceleration
Sale-Leaseback: $2.8B (2023) → $15.6B (2026)—76% CAGR. Institutional buyers (pension funds, sovereign wealth, insurance, REITs) acquiring corporate portfolios generating 8-12% yields with creditworthy tenants, 15-25 year leases, triple-net structures.
Build-to-Suit: $8.3B (2023) → $26.8B (2026)—48% CAGR. Pre-leased development eliminating absorption risk, mission-critical infrastructure (e-commerce logistics, data centers, healthcare, telecom 5G, banking digital transformation).
ESG as Competitive Advantage
Environmental Standards: Green building certification (LEED/EDGE) lowering borrowing costs 50-150 bps, solar installations reducing operating costs 30-50%, renewable energy integration.
Social Impact: Employment creation, local procurement (40-60% targets), affordable housing inclusion (15-25%), community development, skills training.
Financing Benefits: Cost of capital reduction ($250-750K annual savings per $50M project), expanded capital access ($20-30B ESG-mandated allocation), tenant premiums (8-15% rental increase), valuation enhancement (15-25% premium).
Regional Market Dynamics
Nigeria: $12-18B deployment (2024-2027). Cap rates: 10-12% → 8.5-10%. Focus: Lagos logistics, data centers, banking headquarters, FMCG distribution.
Kenya: $6-10B deployment. Cap rates: 9-11% → 7.5-9%. Focus: Technology infrastructure, healthcare, Mombasa logistics corridor, affordable housing.
South Africa: $15-22B deployment. Cap rates: 8-10% → 7-8.5%. Focus: Data centers, renewable energy real estate, e-commerce logistics, manufacturing reshoring.
Ghana: $3-6B deployment. Cap rates: 10-13% → 9-11%. Focus: Oil infrastructure, telecommunications 5G, West African regional distribution, hospitality.
Market Infrastructure Development
Listed REIT Growth: $10B market cap (2024) → $30-40B (2030) through new listings, capital raises, improved liquidity.
Secondary Market Liquidity: Portfolio transactions $3-5B annually (2024) → $15-25B (2030) as institutional trading market develops.
Professional Services: International property managers, specialized legal counsel, institutional appraisers, transaction advisors establishing comprehensive African operations.
Data & Benchmarking: Standardized performance indices, transparent transaction databases, market research publications enabling sophisticated decision-making.
Strategic Outlook: 2025-2030 Trajectory
Institutional Ownership Projections:
- 2025: 10-12% ($35-45B)
- 2027: 15-18% ($60-80B)
- 2030: 22-28% ($100-140B)
- 2035: 30-35% (global emerging market average)
Capital Source Contributions:
- Pension funds: $20-40B (allocation mandates increasing 5% toward 10-15%)
- Sovereign wealth: $20-40B (domestic requirements + international diversification)
- International capital: $25-50B (EM allocation mandates, yield enhancement, diversification)
- Corporate RE monetization: $30-60B (sale-leaseback and build-to-suit transactions)
N3 Capital Africa’s Integrated Platform
We facilitate Africa’s institutional transformation through: capital markets integration (direct relationships with VC funds, sovereign wealth, pensions, insurance, private credit), transaction expertise (SLB structuring, BTS development, portfolio acquisitions, REIT platforms), market intelligence (ground-level presence across Nigeria, Kenya, South Africa, Ghana), ESG leadership (green building, renewable energy, social impact, governance standards).
Value Proposition: Proprietary deal flow access, comprehensive risk mitigation, local operational expertise, active asset management, performance optimization—enabling institutional investors to capitalize on Africa’s once-in-generation transformation while navigating complexity constraining generalist participants.