27
Mar 2026
Real Estate as a Strategic Asset Class: What African Executives Must Know in 2026
By Sir Felix Modebe B.Sc., M.Sc., MBA, FRICS, CCIM, KSJI
Visionary Founder-Leader | N3 CAPITAL AFRICA
The strategic role of corporate real estate has fundamentally transformed across African markets. Where executives once viewed real estate as operational necessity—”space where employees work”—leading African corporations now recognize real estate as strategic asset class demanding C-suite attention, active management, and capital optimization.
This transformation accelerates in 2026 driven by converging forces: real estate evolution from “cost center” to “capital engine,” enterprise-level asset stewardship replacing facility management, Sale-and-Leaseback monetization releasing $15M-$85M capital, ESG sustainability mandates positioning real estate as primary decarbonization lever, balance sheet optimization improving ROIC 300-600 basis points, and capacity pressure as African corporates face capital constraints amid expansion imperatives.
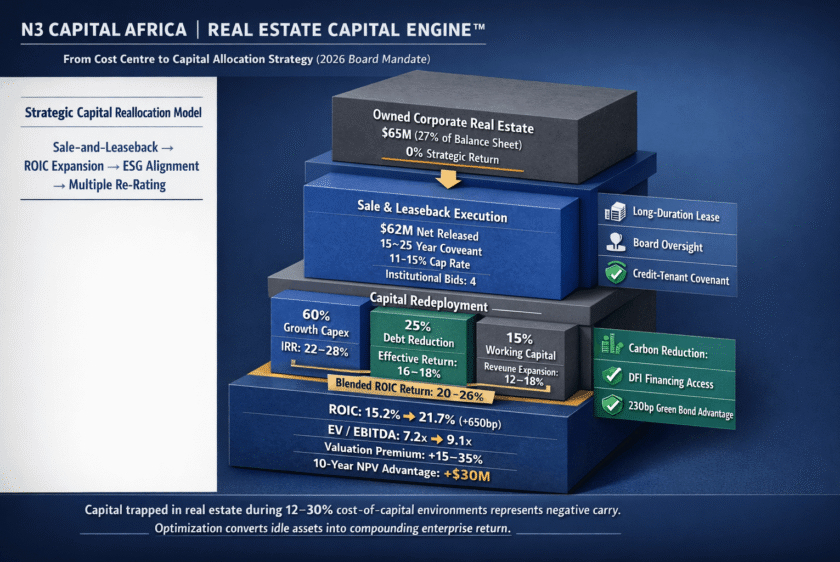
From “Cost Centre” to “Capital Engine”
Traditional mindset (pre-2020): Real estate = operational necessity. Primary question: “Where will employees work?” Management level: Facilities (buried in operations). Board involvement: Minimal.
Strategic transformation (2026): Real estate = capital asset class. Primary question: “How can we optimize real estate capital deployment to maximize ROIC?” Management level: C-suite strategic priority. Board oversight: Real Estate Capital Allocation Committee (CEO, CFO, Independent Director, External Advisor).
What changed?
Capital scarcity intensified: Nigerian CBN 27.25% (from 11.5%), Kenyan CBK 13% (from 7%), Ghanaian BOG 30% (from 14.5%). Every naira/rand/shilling matters—capital trapped in owned real estate (0% return) creates massive opportunity cost when borrowing costs 12-30%.
Digital transformation requirements: Banking $50M-$200M, retail $25M-$100M, telecom $200M-$800M, manufacturing $30M-$150M. Where does capital come from? Debt expensive, equity dilutive → Real estate monetization emerges as “third way.”
Sale-and-Leaseback market matured: African pension funds $450B AUM, insurance $380B AUM, South African REITs $28B, Nigerian REITs $2.1B. Market depth supports $25M-$150M transactions, 15-25 year covenants, competitive pricing (11-15% cap rates). Example: Nigerian bank HQ 2016 attempt = zero institutional bids (market nascent). 2024 execution = 4 competitive bids, 11.5% cap rate secured (vs. 14-16% expected).
The “Capital Engine” concept:
Step 1: Identify owned properties ($15M+ value)
Step 2: Execute Sale-and-Leaseback (sell $28M property, 15-25 year leaseback, net proceeds $26M-$27M)
Step 3: Redeploy capital (60% growth, 25% debt reduction, 15% working capital)
Step 4: Generate superior returns (digital 22-28% IRR, debt reduction 16-18% effective, working capital enables 12-18% revenue growth = blended 20-26% return vs. 4-6% real estate appreciation)
10-Year NPV: Ownership -$18M (negative due to opportunity cost) vs. Sale-and-Leaseback + redeploy +$12M = $30M advantage from treating real estate strategically.
Enterprise-Level Asset Stewardship
Organizational evolution from Facilities Management (buried in operations, tactical mandate “keep buildings running, minimize disruption”) to Strategic Structure (2026): CFO oversight, VP Corporate Real Estate, Board-level Real Estate Capital Allocation Committee with CEO chair.
Why the shift? Real estate becomes material (15-30% of balance sheet, $15M-$85M capital release potential). Board fiduciary duty to optimize capital allocation. Competitive pressure from optimized peers (Company A 2024 Sale-and-Leaseback $48M → ROIC 14.2% → 18.7% +450 bp, valuation multiple 7.2× → 9.8×. Company B delayed → competitive gap widening, ROIC stagnant 13.8%, multiple 6.9×. Board 2026: “Why didn’t we optimize like Company A in 2024? We’ve ceded advantage.”).
Multi-Dimensional Value Creation
Liquidity: Sale-and-Leaseback generates immediate non-dilutive capital ($25M-$150M, 6-9 months vs. equity raise 12+ months, 11-15% cost vs. 16-22% commercial paper).
Governance: Board-level Real Estate Capital Allocation Committee (quarterly reporting, transaction oversight, ESG monitoring) enhances stakeholder confidence. Investors reward (15-25% valuation premium), lenders reduce spreads (50-100 bp), DFIs provide access ($15B+ available 2024-2028 at 7-10% rates).
Resilience: Financial (18-32% cost reduction, $15M-$85M liquidity buffer), operational (leased = flexibility vs. owned illiquidity), strategic (capital available for pivots). Example: Kenyan retailer COVID-19 (2020): Emergency Sale-and-Leaseback $18M → e-commerce investment → survived + thrived (28% e-commerce by 2022). Competitor with trapped real estate → bankruptcy Q4 2021.
Valuation: 15-35% premium for optimized companies (higher ROIC, balance sheet efficiency, strategic optionality, management quality signal). Nigerian bank example: Pre-optimization 2023 EV/EBITDA 7.3×, ROIC 13.2%. Post-optimization 2025 (18 months after $63M Sale-and-Leaseback + consolidation): EV/EBITDA 8.9× (+160 bp), ROIC 17.8% (+460 bp), market cap +29% ($450M → $580M). 44% of valuation gain from multiple expansion (capital efficiency rewarded) vs. 56% from EBITDA growth.
ESG Sustainability Mandates (2026)
Regulatory drivers: SEC (Nigeria), JSE (South Africa), NSE (Kenya), GSE (Ghana) ESG disclosure requirements 2025-2026. DFI financing conditional on ESG alignment (IFC Performance Standards).
Corporate real estate = primary decarbonization lever: 35-45% of Scope 1+2 emissions (largest controllable source).
Decarbonization pathway: Dispersed aging portfolio (87 branches, 420K SF, 12.6M kWh, 10,710 tons CO2e) → Consolidated modern + solar (56 branches, 285K SF, 7.1M kWh, 40% solar, 3,655 tons CO2e) = 66% carbon reduction (7,055 tons).
Financial value: DFI financing access ($45M IFC @ 9.2% vs. commercial 15.8% = $2.97M annual savings), green bond eligibility (230 bp advantage), customer contract retention ($12M European requirements). Total: $3M+ annually, 10-year NPV $18M-$25M from ESG-aligned strategy.
Balance Sheet Optimization & Capacity Pressure
Capital constraint reality (2026): Tier-1 corporation $240M assets including $65M real estate (27%). Growth requirements: Market expansion $30M-$150M, technology $50M-$200M, working capital $20M-$80M. Debt constraints: Leverage covenants at limits, 12-30% borrowing rates. Equity: Dilutive, 6-12 months.
Real estate optimization = preferred solution: Sale-and-Leaseback releases $62M (net) → Assets $237M (real estate 1% vs. 27%), ROIC 15.2% → 21.7% (+650 bp). Investor reaction: Multiple expansion 7.2× → 9.1×, credit rating maintained/upgraded.
Stakeholder Expectations (2025-2026)
Equity investors ask: “What % balance sheet in owned real estate?” (want <10%, concerned if >20%), “Have you evaluated Sale-and-Leaseback?” (test management sophistication), “What’s your ROIC on real estate vs. core business?” (capital discipline), “What’s your 3-5 year real estate strategy?” (clarity).
Reward: ROIC >20% = +15-25% valuation, asset-light <10% real estate = +10-20%, clear strategy = +5-15%.
Penalize: ROIC <12% = -15-25%, asset-heavy >25% real estate = -10-20%, no strategy = -5-10%.
Lenders reward optimization (-50-100 bp spread), penalize suboptimal allocation (+50-150 bp).
Rating agencies: Capital efficiency = rating upgrade consideration. Strategic clarity = management quality signal.
Why This Shift Is Faster in Africa
Africa-specific accelerators:
- Higher cost of capital: 12-30% vs. developed 4-8% → opportunity cost 2-4× higher → optimization ROI dramatically superior
- Diesel dependency: Grid reliability 40-94% (vs. 99%+ developed) → consolidation + solar delivers 40-65% savings (vs. 15-25% developed)
- Rapid logistics expansion: E-commerce 35-50% CAGR → distribution centers require capital → Build-to-Suit enables expansion without balance sheet impact
- Digital economy: 45-65% mobile data growth, cloud adoption, 250+ fintechs → data center real estate strategy critical
- Global investor demands: International institutional capital requires governance maturity → Board-level real estate committees signal sophistication
The 2026 Imperative
Three windows closing:
Window 1: Institutional capital (2024-2028): Pension funds deploying aggressively (8-15% allocation targets). First movers access favorable terms (11-13% cap rates). Risk: Market saturation 2027-2029 compresses rates to 9-11%.
Window 2: Competitive positioning (2024-2026): Peers optimizing today building ROIC advantage. Delay to 2027-2028 = play catch-up while competitors invest proceeds in growth.
Window 3: ESG compliance (2025-2027): Regulatory mandates phasing in. Proactive optimization achieves compliance ahead of requirements. Reactive 2027-2028 = rushed, suboptimal, costly.
First-mover outcomes (2023-2025 executions): Capital released $15M-$85M, ROIC improvement 300-600 bp, valuation premium 15-35%, market share gains, carbon reduction 45-70%, DFI access.
- Late movers (2027-2028): Deteriorated capital terms, widening competitive disadvantage, valuation discount, ESG compliance scramble.
Strategic question for every CEO and Board:
“Why do we own $50M-$200M real estate generating 0% return when we could: (1) Release $45M-$180M via Sale-and-Leaseback, (2) Redeploy to core business (18-28% ROIC), (3) Improve consolidated ROIC 300-600 bp, (4) Achieve 45-70% carbon reduction, (5) Preserve operational continuity, (6) Generate $20M-$80M incremental value (10-year NPV)?”
Answer increasingly: “We shouldn’t own real estate for operational purposes—we should optimize it strategically.”
EXECUTIVE REAL ESTATE STRATEGY ASSESSMENT
N3 Capital Africa offers Board-level Real Estate Strategy Assessment for Tier-1 African corporations (Complimentary for Qualified Engagements):
What’s Included:
Strategic Assessment:
- Current portfolio analysis (owned/leased, utilization, costs, capital deployed)
- Sale-and-Leaseback opportunity quantification ($15M-$85M typical)
- Capital redeployment scenarios (growth, technology, debt reduction, working capital)
- ROIC impact modeling (300-600 bp improvement typical)
- ESG compliance pathway (carbon reduction, renewable integration, green certification)
- Competitive benchmarking (peer capital efficiency, valuation multiples)
Deliverables:
✓ Executive Strategy Memo (25-40 pages, Board-ready)
✓ Financial Models (optimization economics, 10-year NPV)
✓ Implementation Roadmap (12-18 months)
✓ Institutional Investor Marketing Strategy (Sale-and-Leaseback execution)
✓ ESG Compliance Roadmap (regulatory requirements, DFI alignment)
Schedule Your Executive Real Estate Strategy Assessment
📧 info@n3capital.africa
🌐 www.n3capital.africa
For Board Directors and C-Suite Executives
Response time: 24 hours for Board-level inquiries